Time Series Analysis Part 0: Data Cleaning
Time Series Analysis Part 0: Data Cleaning
This is part of a series of posts that aims to capture and compile the knowledge required in order to analyse time series data. This part will take you through the basics of cleaning the data.
We are going to deal with the most common problem in time series data when it is tabular; missing rows. A mistake that all beginners make is that they check for missing values and find that there are no missing values. However, given the granularity or frequency of the data some of the rows or records themselves might be missing.
Let me provide you with an example: Let’s say the frequency of your data is daily, meaning for a particular month there should be 30 or 31 values depending on which month it is. Now you may group the data by months and check the count; if it’s less than 30 or 31 you know there is a missing row.
However there’s a better way and one that can be generalised to any and all frequencies. All it takes is date-time functionality of python\pandas and an understanding of how joins work.
Here’s a snippet:
def check_missing_records(df, datetime_col, freq):
    '''
    Creates a DatFrame with missing datetime rows (if any) added & missing rows info.
    Args:
        df: the dataframe with potentially missing datetime rows.
        datetime_col: the name of the datetime column in the df to check missing periods.
    Returns:
        the reconstituted df with missing rows added back.
    '''
    hold = pd.date_range(start=df[datetime_col].min(),end=df[datetime_col].max(),freq=freq)
    hold = pd.DataFrame(hold, columns=['datetime'])
    reconstituted_df = pd.merge(hold, df, how='left', left_on='datetime', right_on=datetime_col)
    missing_datetime_info = reconstituted_df.isnull().sum()
    return reconstituted_df, missing_datetime_info
The function works by left-joining the dataframe with a newly constructed dataframe that only has a date-time column containing the range of values starting from the earliest timestamp and ending at the latest timestamp with the frequency from the original dataframe. Note that the above function returns two objects: the dataframe left joined with an index constructed from the range of smallest timestamp to the largest timestamp & the sum of all missing values across different series found in this new df. One can modify the function to return just the reconstituted df.
Once you have done this you might end up with some thing like the following:

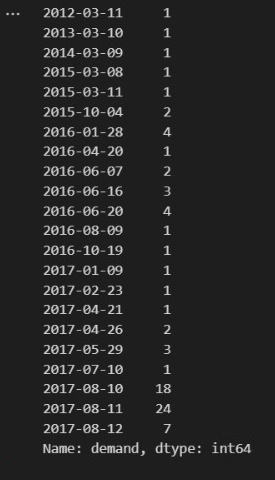
Time Series Missing Values
The above image shows the missing periods in a time series with a 24 hours frequency. It’s safe to interpolate the dates for which only a few timeblocks are missing. Here’s a snippet of how to do that using pandas (The method is essentially a wrapper around interpolation techniques provided by scipy).
df['target'].interpolate(inplace=True)
However the dates for which almost the entire data is missing it would be safe to substitute with the mean of for that time period; decided by considering the hourly, daily, weekly or monthly pattern. You can head over to Part 1 where we will visualise the data in order to drill down and see such patterns.